7 Charts That Will Define Data Centers in 2026
Seven charts reveal the forces that will shape the data center market in 2026 — from power scarcity to interconnection delays and the rise of private generation. These visuals explain what’s coming next.


2025 reshaped everything we thought we understood about data center growth.
AI demand outpaced every forecast.
Transmission queues hit historic highs.
Long-lead equipment became the new critical path.
And the industry entered what is effectively a multi-year, global race for power.
But the real story — and the one that will define 2026 — is visible in the data.
These seven charts explain the next phase of the build-out, the risks operators aren’t pricing in yet, and the opportunities emerging for those who can execute under constraint.
Let’s begin.
1. The AI Power Curve: AI Demand vs. Grid Expansion Capacity
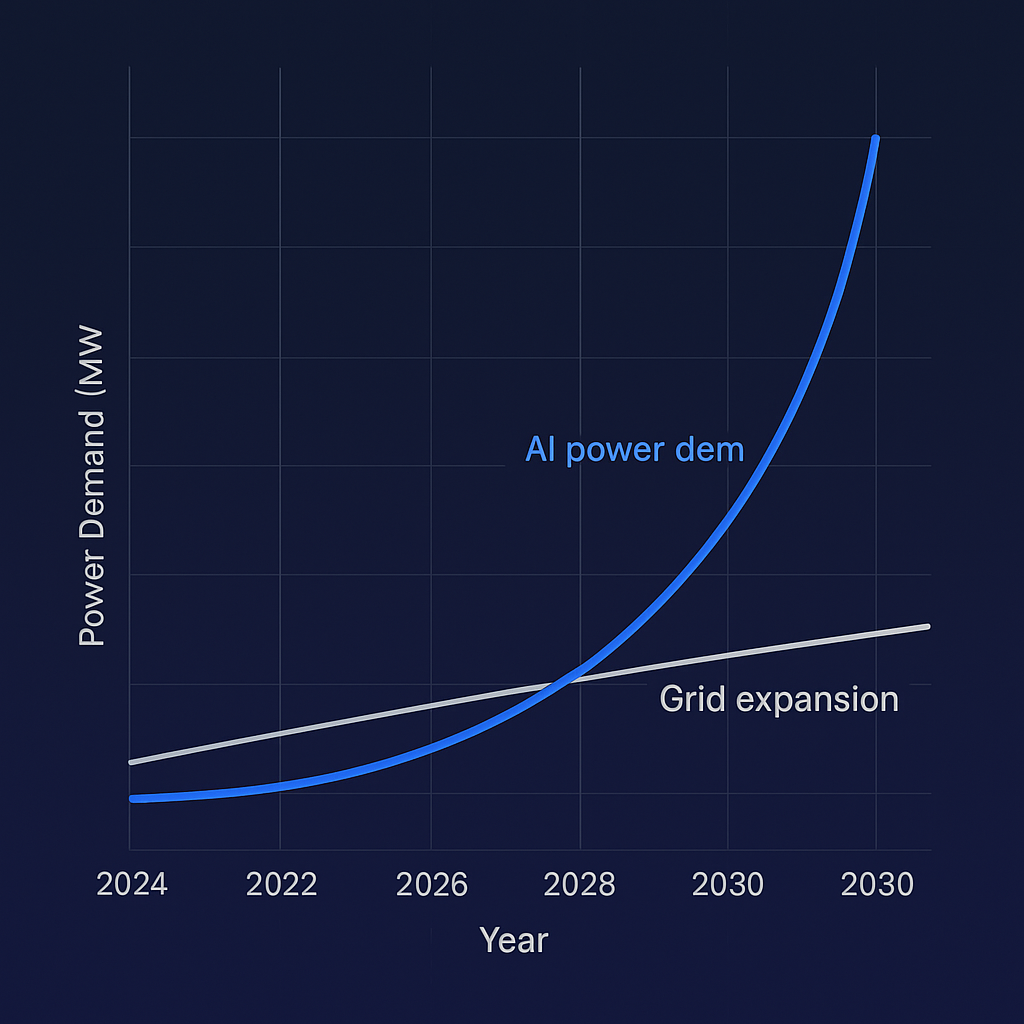
A widening gap is emerging between the power AI workloads require and the grid’s ability to deliver it.
This chart makes the divergence impossible to ignore:
AI demand rising exponentially; grid capacity expanding linearly.
If this gap persists, the next constraint isn’t GPUs — it’s electrons.
2. Transformer Lead Times Are at a Four-Decade High
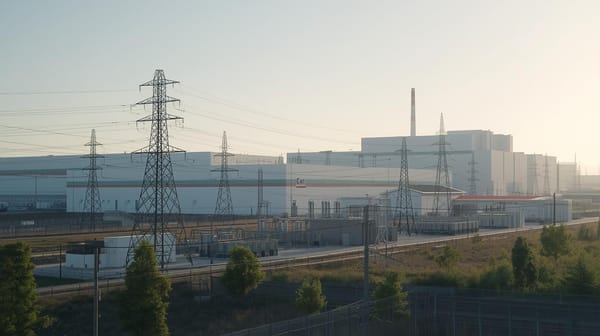
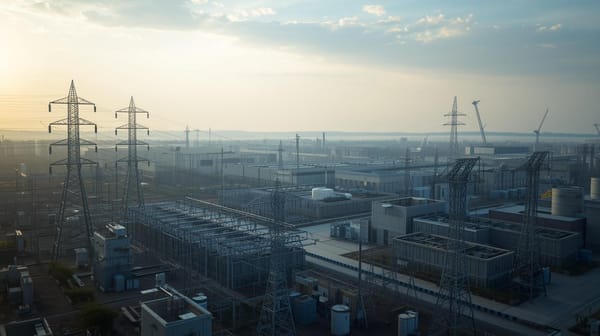
Transformer and switchgear lead times have quietly become one of the defining constraints in the modern data center.
From sub-50 weeks to 90+ weeks in less than three years, long-lead equipment timelines have turned sequencing into a primary execution risk.
This is the hidden bottleneck shaping 2026 project schedules.
🟦 Want access to all 7 charts?
The next five charts — including the one every investor will screenshot — are available only to DCE Premium subscribers.
Upgrade for $19/mo to unlock the full chartpack + analysis.
👉 Members gain access to all future chartpacks, frameworks, and deep-dive research.